Dashboard Filters
Last updated
Last updated
The widgets on the dashboard use either a dataset or a script as a data source. Most scripts use datasets as well, hence the basis of every widget is one or multiple datasets. The global filters are applied to all datasets belonging to widgets in the corresponding section. But the global timestamp filter only affects columns with a key ending in ".timestamp" and the global thing filter only affects those columns with a key ending in ".thing". These are the metadata columns of the different events.
So for example the first column in the picture below would be affected by the global thing filter. The second column would be affected by the global timestamp filter but the third one not even though it is of type timestamp.
Note that if a global filter is set to "None" it does not override any column filters. This behaviour is different for custom filters.
First, choose the section in which you want to change the global filter settings.
You can select and copy the filter ID. This ID is used in the dashboard sharing URL.
Set a default value for the global filter (problems with changing default global timestamp filter?).
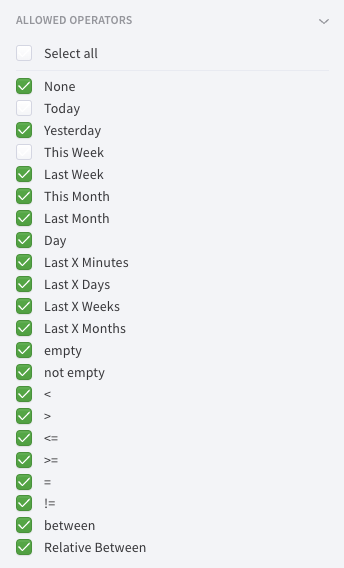
When opening the allowed operators section, you can change what operators should be selectable in the operator select of the filter. To allow an operator, simply make sure that it is selected in the operator list.
Inside the filter definitions section you can define custom operators you can use for this filter. You can find more information on custom filter definitions here.
You can synchronize the global filter across all sections with this checkbox.
If you do not want someone with view permissions to change the global filter you can hide it with this checkbox.
Makes the Global Thing filter to also consider dimension things, which is turned off by default. Available only for the Global Thing filter.
Note, if you have a default setting for a hidden filter the default setting will still get applied.
Besides the two global filters that are always available for every dashboard section, there is also the option to create your own custom filters. While global filters automatically filter e.g. all timestamp columns, custom filters need to be connected with specific columns/results of any dataset/script that your current dashboard widgets use. This allows you to create filters that override specific columns/results of your datasets/scripts that a global filter wouldn't be able to.
To create your own custom filters, you can click the Add Filter button right below your global filters.
After clicking Add Filter, a modal window opens, where you can define your new filter. This modal will basically show you all columns/results from any dataset/script that is currently used anywhere on your dashboard (this also includes columns/results used in e.g. progress bar limits, gauge chart color states, plot lines in multi charts). But you don't just get shown the whole list at once, the list will be filtered by multiple settings at the top of the modal.
The first thing you can select is the filter type. The filter type will define what type your filter is and to what types of columns/results, it can be connected. For example, if you select Text as the filter type, the list of available columns/results will only show entries that are also of type text (or string to be precise).
Next up, you can switch between Dataset and Script as the datasource type. If you select the dataset you will be shown all dataset columns of datasets used in your dashboard, and vice versa if you select the script, you will see all script results of scripts used in your dashboard.
After selecting the filter type and the datasource type, you can further filter your list of results by using the search input field. This will filter the list by checking if the value you entered is contained in either the column/result name, the dataset/script name or the widget names that the column/result is used in.
Now you should be able to see a list of columns/results filtered by all the settings you've defined (or none if there are no columns/results available for your settings). Every column/result in the list will show you various information, like its name, the dataset/script it comes from, its datatype, and a list of widgets it is used in.
Additionally, every row has an Add button, which after you click it, will connect the column/result to your custom filter. After connecting, the Add button will be replaced with a trashcan icon, which can be used to remove the connection to your custom filter again.
A custom filter can only be connected with columns/results of one datatype. This means, that when you change the datasource type to a new value, all the existing connections you've added will be deleted.
Also note, that this constraint doesn't exist on the datasource type, which means that you can connect your custom filters to dataset columns and script results at the same time.
After you are done with connecting columns and results to your custom filter, click the Finish button. Your custom filter is now displayed directly below the global filters.
If a global filter and a custom filter are applied to the same column the custom filter will always override the global filter.
Note that, if a custom filter is set to "None" this will be also applied to the defined column, erasing the filter which was defined in the dataset.
If multiple widgets from one section use the same dataset the custom filter can not differentiate between these widgets and will always filter the column for those widgets.
After opening the filter settings of any filter, you will have the option to open a section called allowed operators. Here you have the possibility to select which operators should be available for your filter. For example, in a timestamp filter, you could only allow the Today, Yesterday and Day operators. Your default operator and the filter in dashboard view mode will then only show these three operators for selection.
When you disallow an operator that is currently set as your default operator, your default operator will change to None. If the none operator is also disallowed you will get an error message in your default operator that will tell you to select another default operator.
You need to select at least one allowed operator.
With custom filter definitions, you have the ability to create your own filter operators.
A custom filter definition is basically defined by a name and a filter that should be used when the custom filter definition is selected.
As an example, you could define an IsThing1 operator, that uses an equals operator and has "Thing1" as a parameter. The users viewing your dashboard in view mode will then have the possibility to just select your custom IsThing1 operator on the filter, instead of having to manually select the equals operator and write "Thing1" as a parameter.
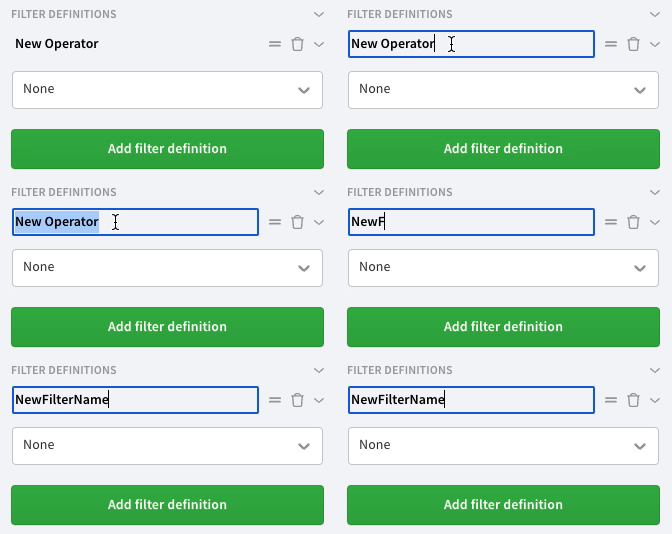
To create a custom filter definition, navigate to any filter settings in the dashboard edit mode, and open the Filter definitions section. You will be presented with a button Add filter definition with which you can create as many filter definitions as you want.
After creating a new filter definition, you can rename it by simply clicking on the name and entering a new name (same as how you would rename the filter itself).
After opening the filter definitions settings, you have the option to change the operator and (if the selected operator supports it) add parameters.
After creating your filter definition, it should now show up in the select for the filter's default operator:
If everything worked fine, you should now also be able to select your custom filter definition in dashboard view mode.
If you disallow e.g. the equals filter in the allowed operators, you can still use the equals operator in a filter definition.
When defining a dashboard drill-down, you will not pass your filter definitions to any target dashboard. For example, the IsThing1 operator in the example above will simply get passed as an "= Thing1" filter to a target dashboard. Please note that therefore the filter operator (in this case "=") must be allowed.
When using the Copy Sharing URL function in the dashboard, which uses a custom filter with a filter definition having the disallowed operator - the user is still going to be able to land on the dashboard with the applied preselected filter from the copied URL.
When clicking on a widget in the dashboard edit mode, the “Widget” menu appears. If there is a need to allow showing widgets with the original dataset (or script) filters even when the dashboard gets filtered, there is an option to disable dashboard filters for that widget.
To disable dashboard filters, enable the option "Disable dashboard filters" in the widget menu. After the option is enabled, a list of dashboard filters will show up below. Each filter can be disabled or enabled individually with a checkbox.
As default, when activating the “Disable dashboard filters” menu option, all individual filter checkboxes are activated, which means, no dashboard filter is used for the widget in the dashboard. Otherwise, if dashboard filter option is deactivated, it means dashboard filter is used for the widget in the dashboard.
For example, in the scenario from the screenshot below, Global Timestamp and Global Thing filters are not used for the widget, but the custom timestamp filter is used for the widget in the dashboard.
Disable dashboard filters option is disabled by default.
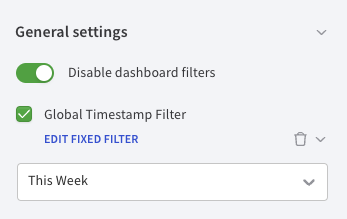
When a specific dashboard filter is disabled this way, you will see a new link showing up below every disabled dashboard filter labeled Set fixed filter. After clicking this link and opening the filter by clicking on the arrow icon to the right, you can set a fixed filter that will be used for your selected widget instead of the dashboard filter.
To remove a fixed filter again, simply click on the trashcan icon.
A text fallback filter replaces the default values to which the user doesn't have access with a first value available to which he has access. In other words, if one of the default values is not present in the filter suggestions list it will be replaced with the first one available. If there are no suggestions then no default value will be shown in the filter. To create a text fallback filter you have to create a text custom filter and enable the "Handle Fallback Value" checkbox.
The 'Handle Fallback Value' checkbox was introduced to reduce the burden of dashboard loading and performance by avoiding the execution of redundant default fallback checks for each custom filter.
The functionality is pretty much the same as for the Thing filter and can be very useful when you have only dimension filters on the dashboard and you want the final user to see only the values he has access to. Let's see next an example of how this filter can be used: User1 creates a dashboard with a custom text filter that has a dimension column behind it. In this case, User1 has access to five different Things instances.
Next, User1 enables the fallback logic for this text filter and sets a default value:
the Later, the dashboard is shared with User2, which has access only to Instance1 and Instance2. When User2, opens this dashboard, the fallback logic will called and the User will see the first value he has access to as the default filter value:
The default values that are not in the suggestion list will be replaced with the first one regardless of the operator type.