Dashboards
Last updated
Last updated
In the overview screen of the dashboards menu, you are able to access and share existing dashboards or create new ones. On a dashboard, you can display multiple widgets. You can also set filters on a dashboard, which overrides the filters from the dataset and make the dashboard a flexible tool to display not only the data you defined in the dataset.
If you create a new dashboard you will get directed to the dashboard edit mode.
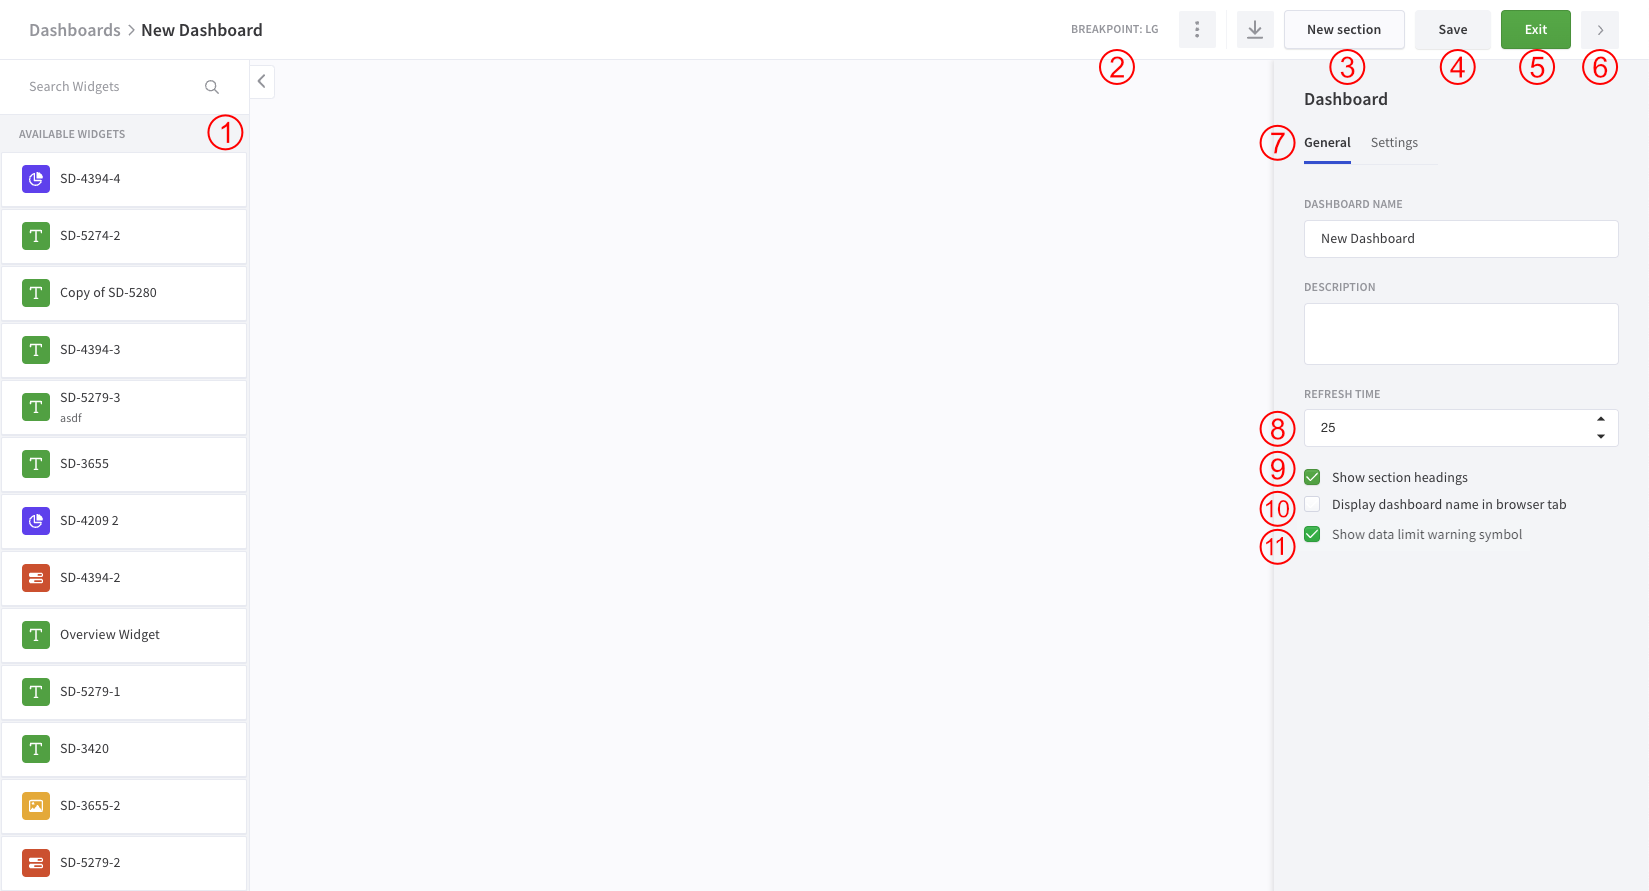
Searchable register of all available widgets. To place a widget in a section, just drag the desired widget into it.
You can set the arrangement of the widgets separately for different screen sizes. The breakpoint indicator tells you which screen size you are currently using.
You can split a dashboard into different sections for structure and for controlling filters. A filter is part of a section and can only affect the widget in this section.
If you change something the save button will be enabled and will save the dashboard if pressed.
Exit the edit mode, make sure your changes are saved.
Collapse and expand the right sidebar.
In the "General" tab you can define name, description, refresh time, and if the section headers should be shown. In the "Settings" tab you can change the settings for filters and the time zone for each section (details in Dashboard Filters and Time Zones).
With the refresh time (in seconds) you define how regularly the widgets on the dashboard are refreshed.
Hide or show the header of the sections.
Select whether the dashboard name of this dashboard should be displayed in browser tab.
Select to enable data limit warning symbol for all widgets in the dashboard
If you want to change an existing dashboard you have to click on this dashboard in the overview list and then enter the edit mode (edit mode is only available if your users have to have write permissions to this dashboard).
As mentioned above, sections help you to structure your dashboard and you can apply a different filter on widgets if they are in different sections. If you are in the edit mode you can create and rename the sections.
Note that when the second section got added you gained the option to synchronize the scroll bars. Look for this option in the top bar, next to the breakpoint indicator.
By drag and drop, you can add new widgets and change the layout of the dashboard. By dragging the bottom right corner of a widget you can change its size.
If you want to have a widget in a different section. Delete it and drag a new one into the right section from the register.
Depending on your screen size and zoom your dashboard will be within different breakpoints (you can see the breakpoint indicator in the top bar when you are in the edit mode taking values from XXS to LG). You can define a different layout for every breakpoint. Just zoom in or out until you are in the right breakpoint. Now you can change the layout and save it. Now this layout will be applied whenever someone within this breakpoint views the dashboard.
If you enter an existing dashboard (or exit the edit mode) you are in the view mode. In the view mode, one can only change the dashboard filters and time zone, not the layout or the used widgets.
By default, every section has a global timestamp and thing filter. Time zones or custom filters need to be defined in the edit mode (details in Dashboard Filters and Time Zones).
The check is performed for the widget datasource limit against data available from the dashboard filter criteria: if the data rows count is greater than datasource limit, the info icon is shown. On the symbol hover, the following message is shown: "Not all data is displayed".
If datasource limit for a widget is not set, then the default value is used (5000) and checked against.
This feature is only available for widgets with datasource limit(e.g. table, pie, multi, etc)
By default, this feature is disabled but the state can be changed in the dashboard editor. Select the widget you want to set the limit notification status and in the settings panel, you can update the state (active/inactive).
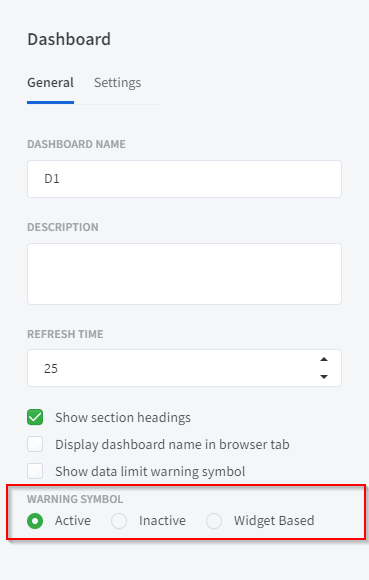
Warning symbol can be toggled at the dashboard level.
Options available are:
Active - means all warning symbols on a dashboard will be turned on, regardless of setting on widget level
Inactive - means all warning symbols on a dashboard will be turned off, regardless of setting on widget level
Widget Based - means warning symbol is shown depending on a setting on widget level for each individual widget
If option Active or Inactive on dashboard level are selected, warning symbol setting on a widget level is not shown.
When using scripts as datasource, it is possible to limit the dataset(if present) data directly at the script level. If there are more rows to be returned, but capped due to this limit, the rows beyond the limit are ignored and not considered in the widget data limit check. Only script final data will be considered.
In the view mode, you can click on (further options) of a widget to access the widget description via the-button. You can define the information displayed in thereby setting the description of the widget in the widget editor.
Near to the (further options) icon you can find a grey info icon which is displayed when not all data within the set filters in Dashboard is shown in the widget.